Collect GPS, speed, and stop-duration data in real time to precisely analyze every trip. Compare actual driving against the optimal route, with AI auto-detecting unnecessary detours and excessive stops.
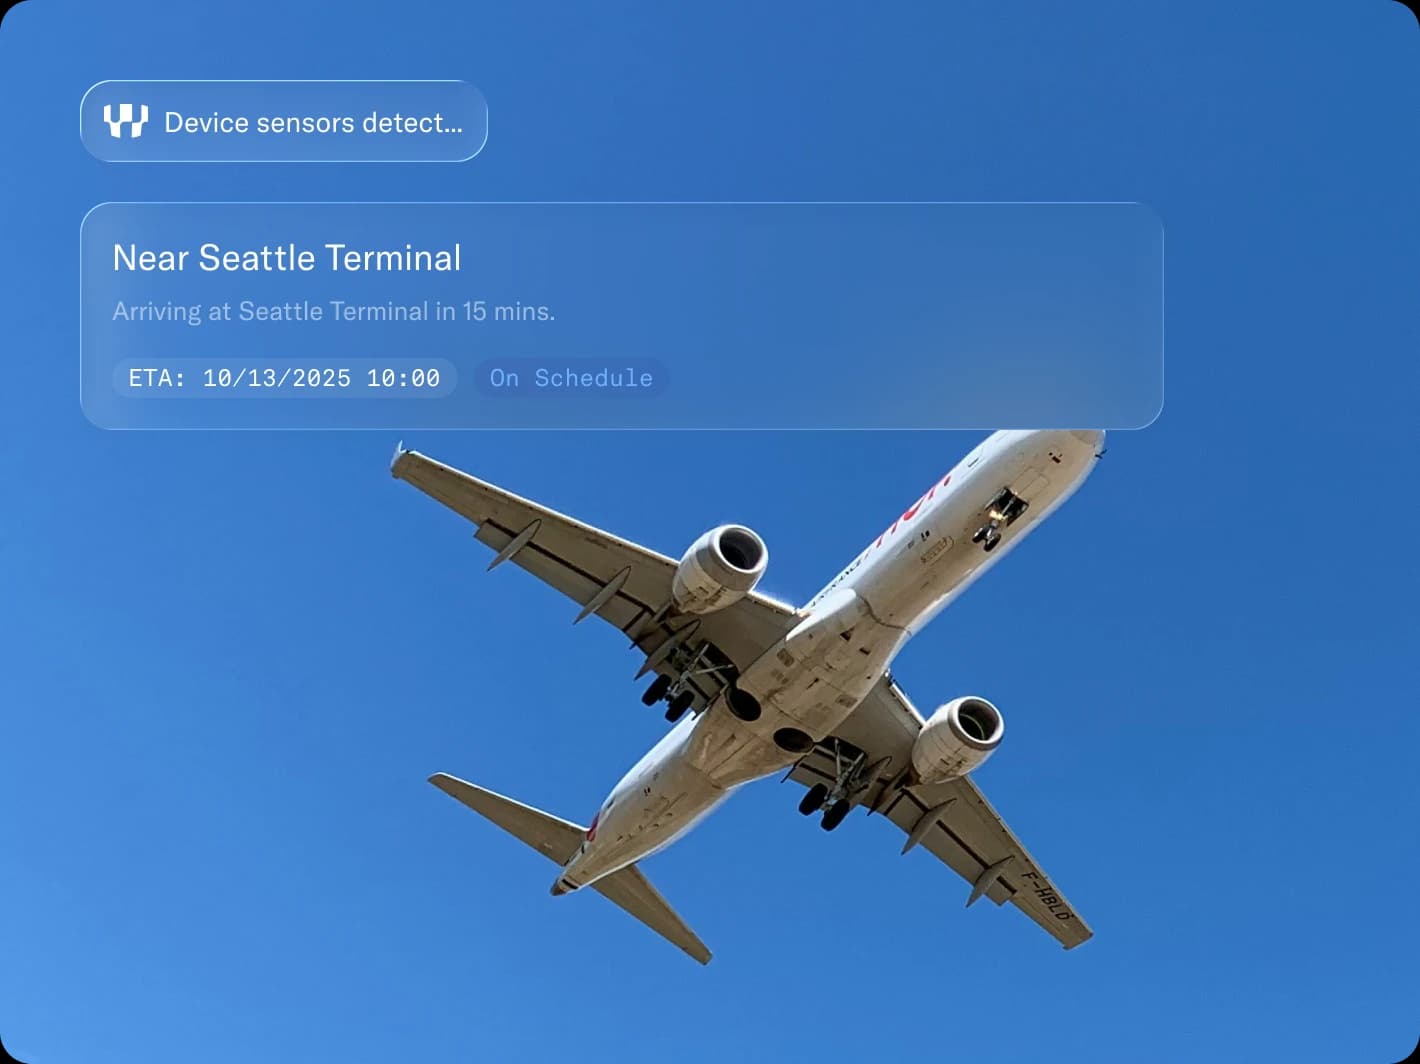
Collect GPS, speed, and stop-duration data in real time to precisely analyze every trip.
causes billions of dollars in losses every year.

A segment that should take 3 hours via the optimal route is arriving in 4 hours 30 minutes. Actual distance is 40% longer, but the cause is unknown.

A short-distance trip takes 2.5× longer than expected. Where and how long the vehicle stopped is impossible to verify. Each driver has different stop patterns, making standardized management hard.

Same route, same vehicle — driver A averages 3 hours, driver B averages 4 hours 30 minutes. No data shows who is efficient and who needs improvement.

Only after a customer claim do you learn 'delivery was late.' Without real-time monitoring, response during the incident is impossible.
causes billions of dollars in losses every year.
A segment that should take 3 hours via the optimal route is arriving in 4 hours 30 minutes. Actual distance is 40% longer, but the cause is unknown.
A short-distance trip takes 2.5× longer than expected. Where and how long the vehicle stopped is impossible to verify. Each driver has different stop patterns, making standardized management hard.
Same route, same vehicle — driver A averages 3 hours, driver B averages 4 hours 30 minutes. No data shows who is efficient and who needs improvement.
Only after a customer claim do you learn 'delivery was late.' Without real-time monitoring, response during the incident is impossible.
Real-Time Vehicle Operation Data Collection
Capturing location, speed, and stoppage time for every vehicle at one-minute intervals, ensuring complete and accurate records of all fleet operations.
Optimal Route Analysis
Calculating the shortest distance and fastest time using OSRM (Open Source Routing Machine), then comparing against actual routes driven to identify inefficient segments.
AI Anomaly Classification
Analyzing vehicle operation data with AI to automatically classify abnormal patterns
Actionable Insights Delivery
Detecting abnormal driving in real time while improving overall transport efficiency through driver-specific improvement points and long-term pattern analysis.
Real-Time Vehicle Operation Data Collection
Capturing location, speed, and stoppage time for every vehicle at one-minute intervals, ensuring complete and accurate records of all fleet operations.
Optimal Route Analysis
Calculating the shortest distance and fastest time using OSRM (Open Source Routing Machine), then comparing against actual routes driven to identify inefficient segments.
AI Anomaly Classification
Analyzing vehicle operation data with AI to automatically classify abnormal patterns
Actionable Insights Delivery
Detecting abnormal driving in real time while improving overall transport efficiency through driver-specific improvement points and long-term pattern analysis.
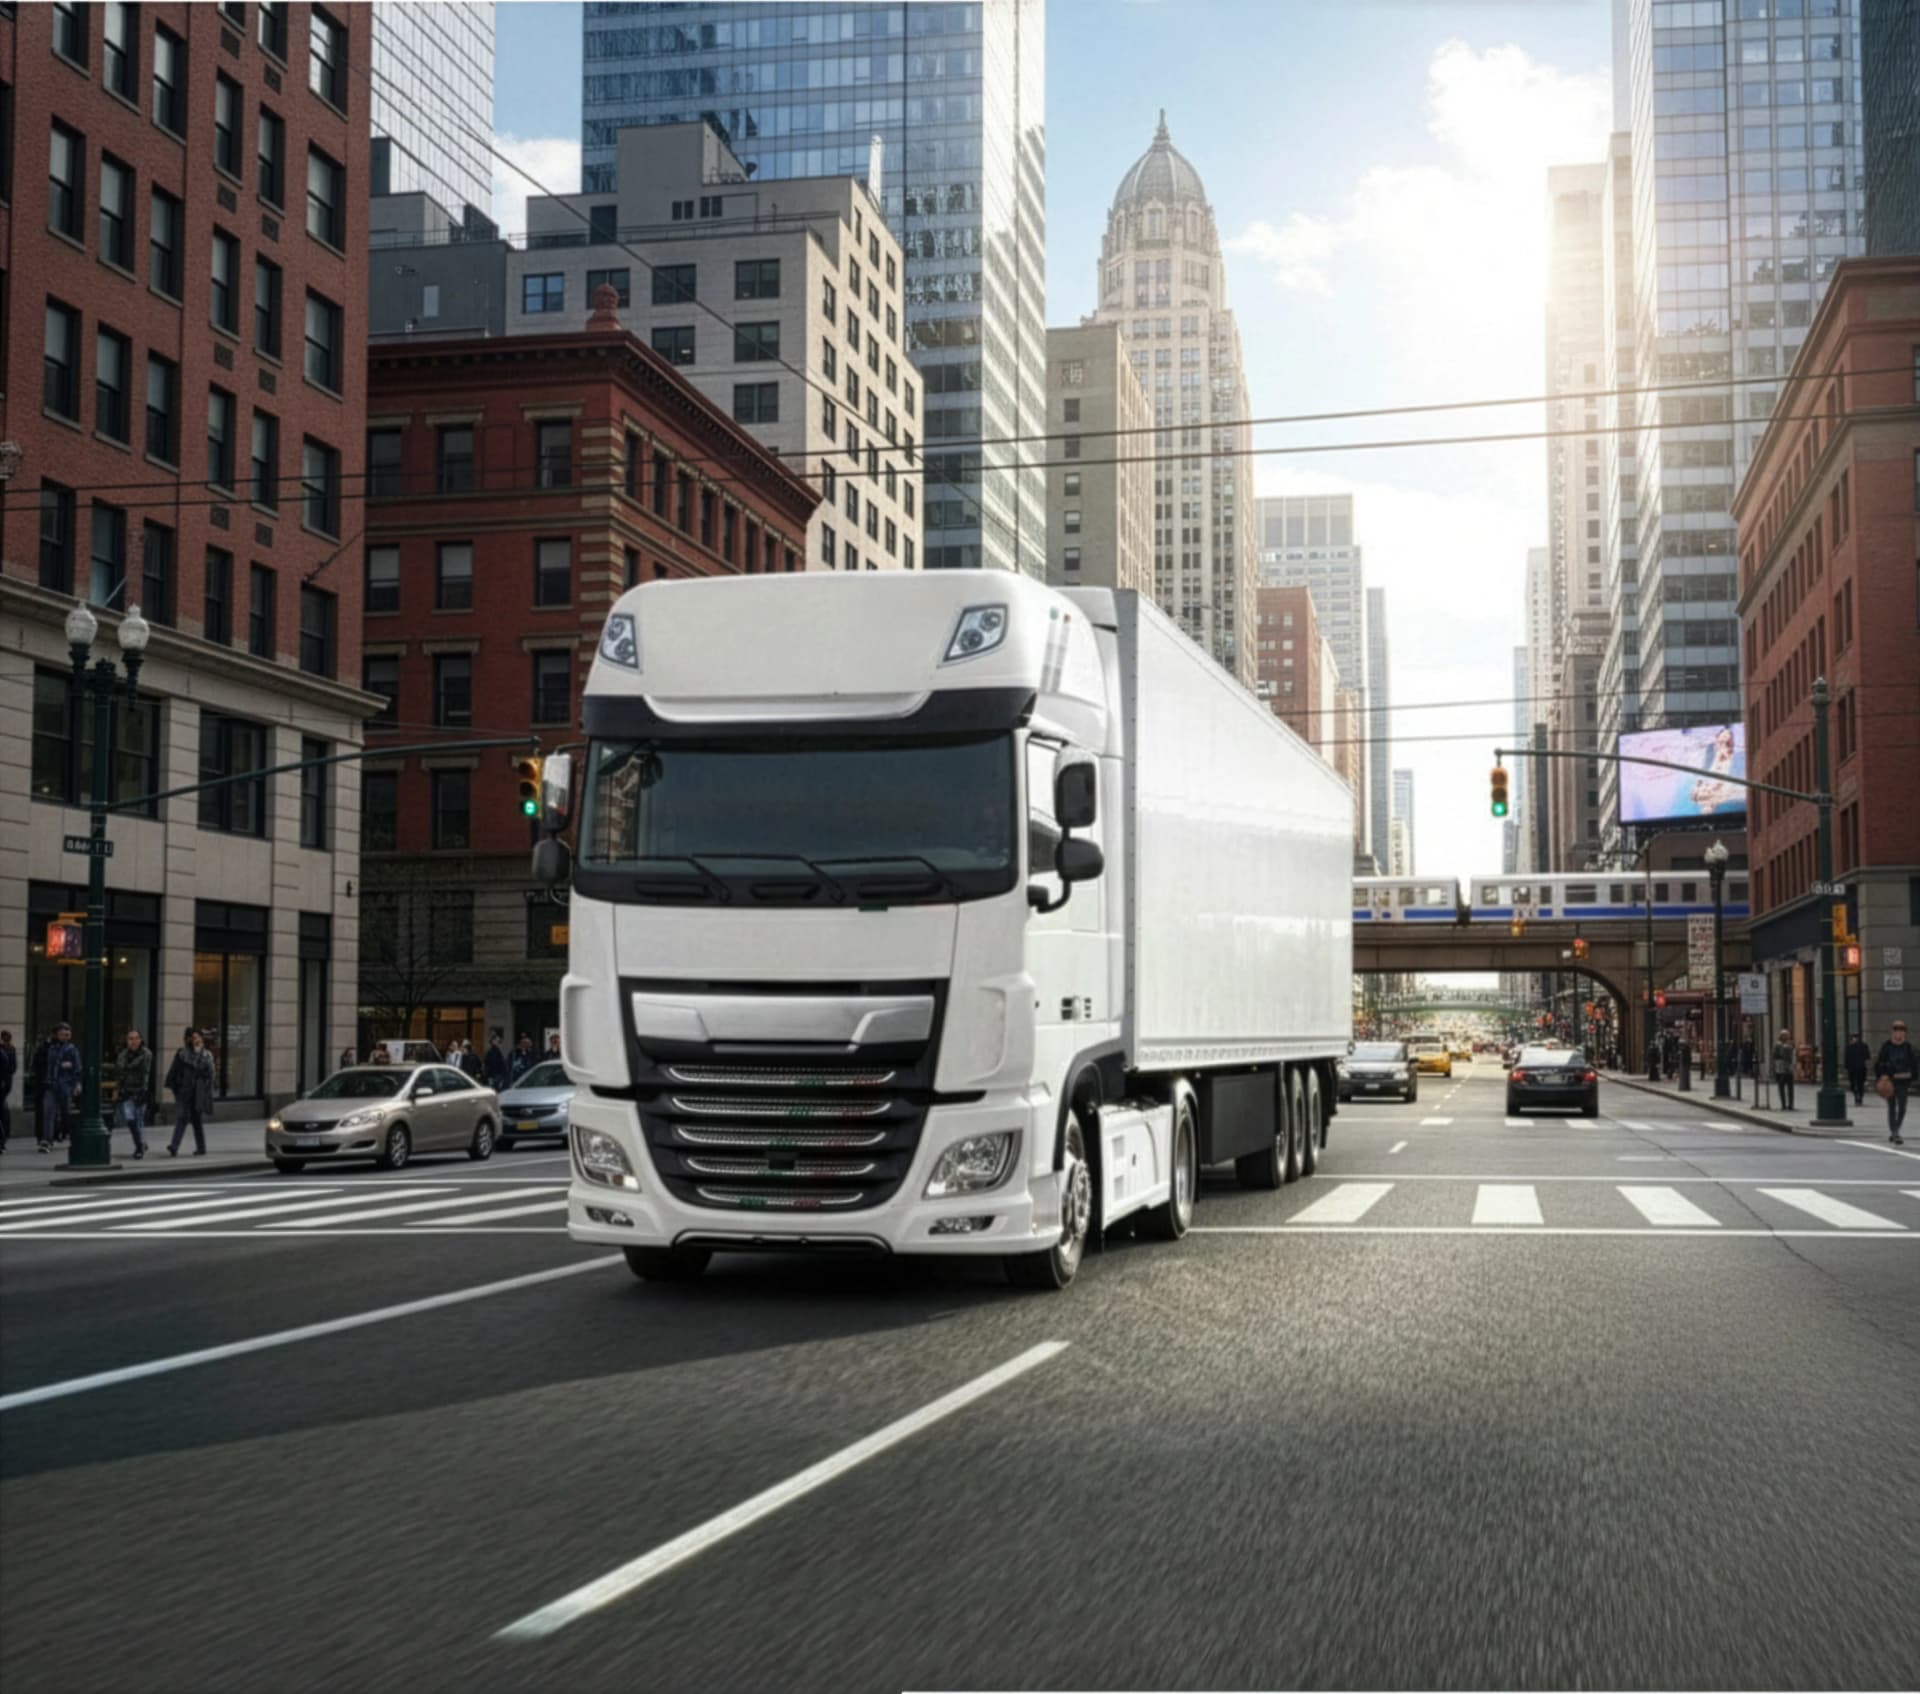
Analyzing GPS-based vehicle operation data with AI to diagnose abnormal stoppage patterns and track driver-specific improvement outcomes.
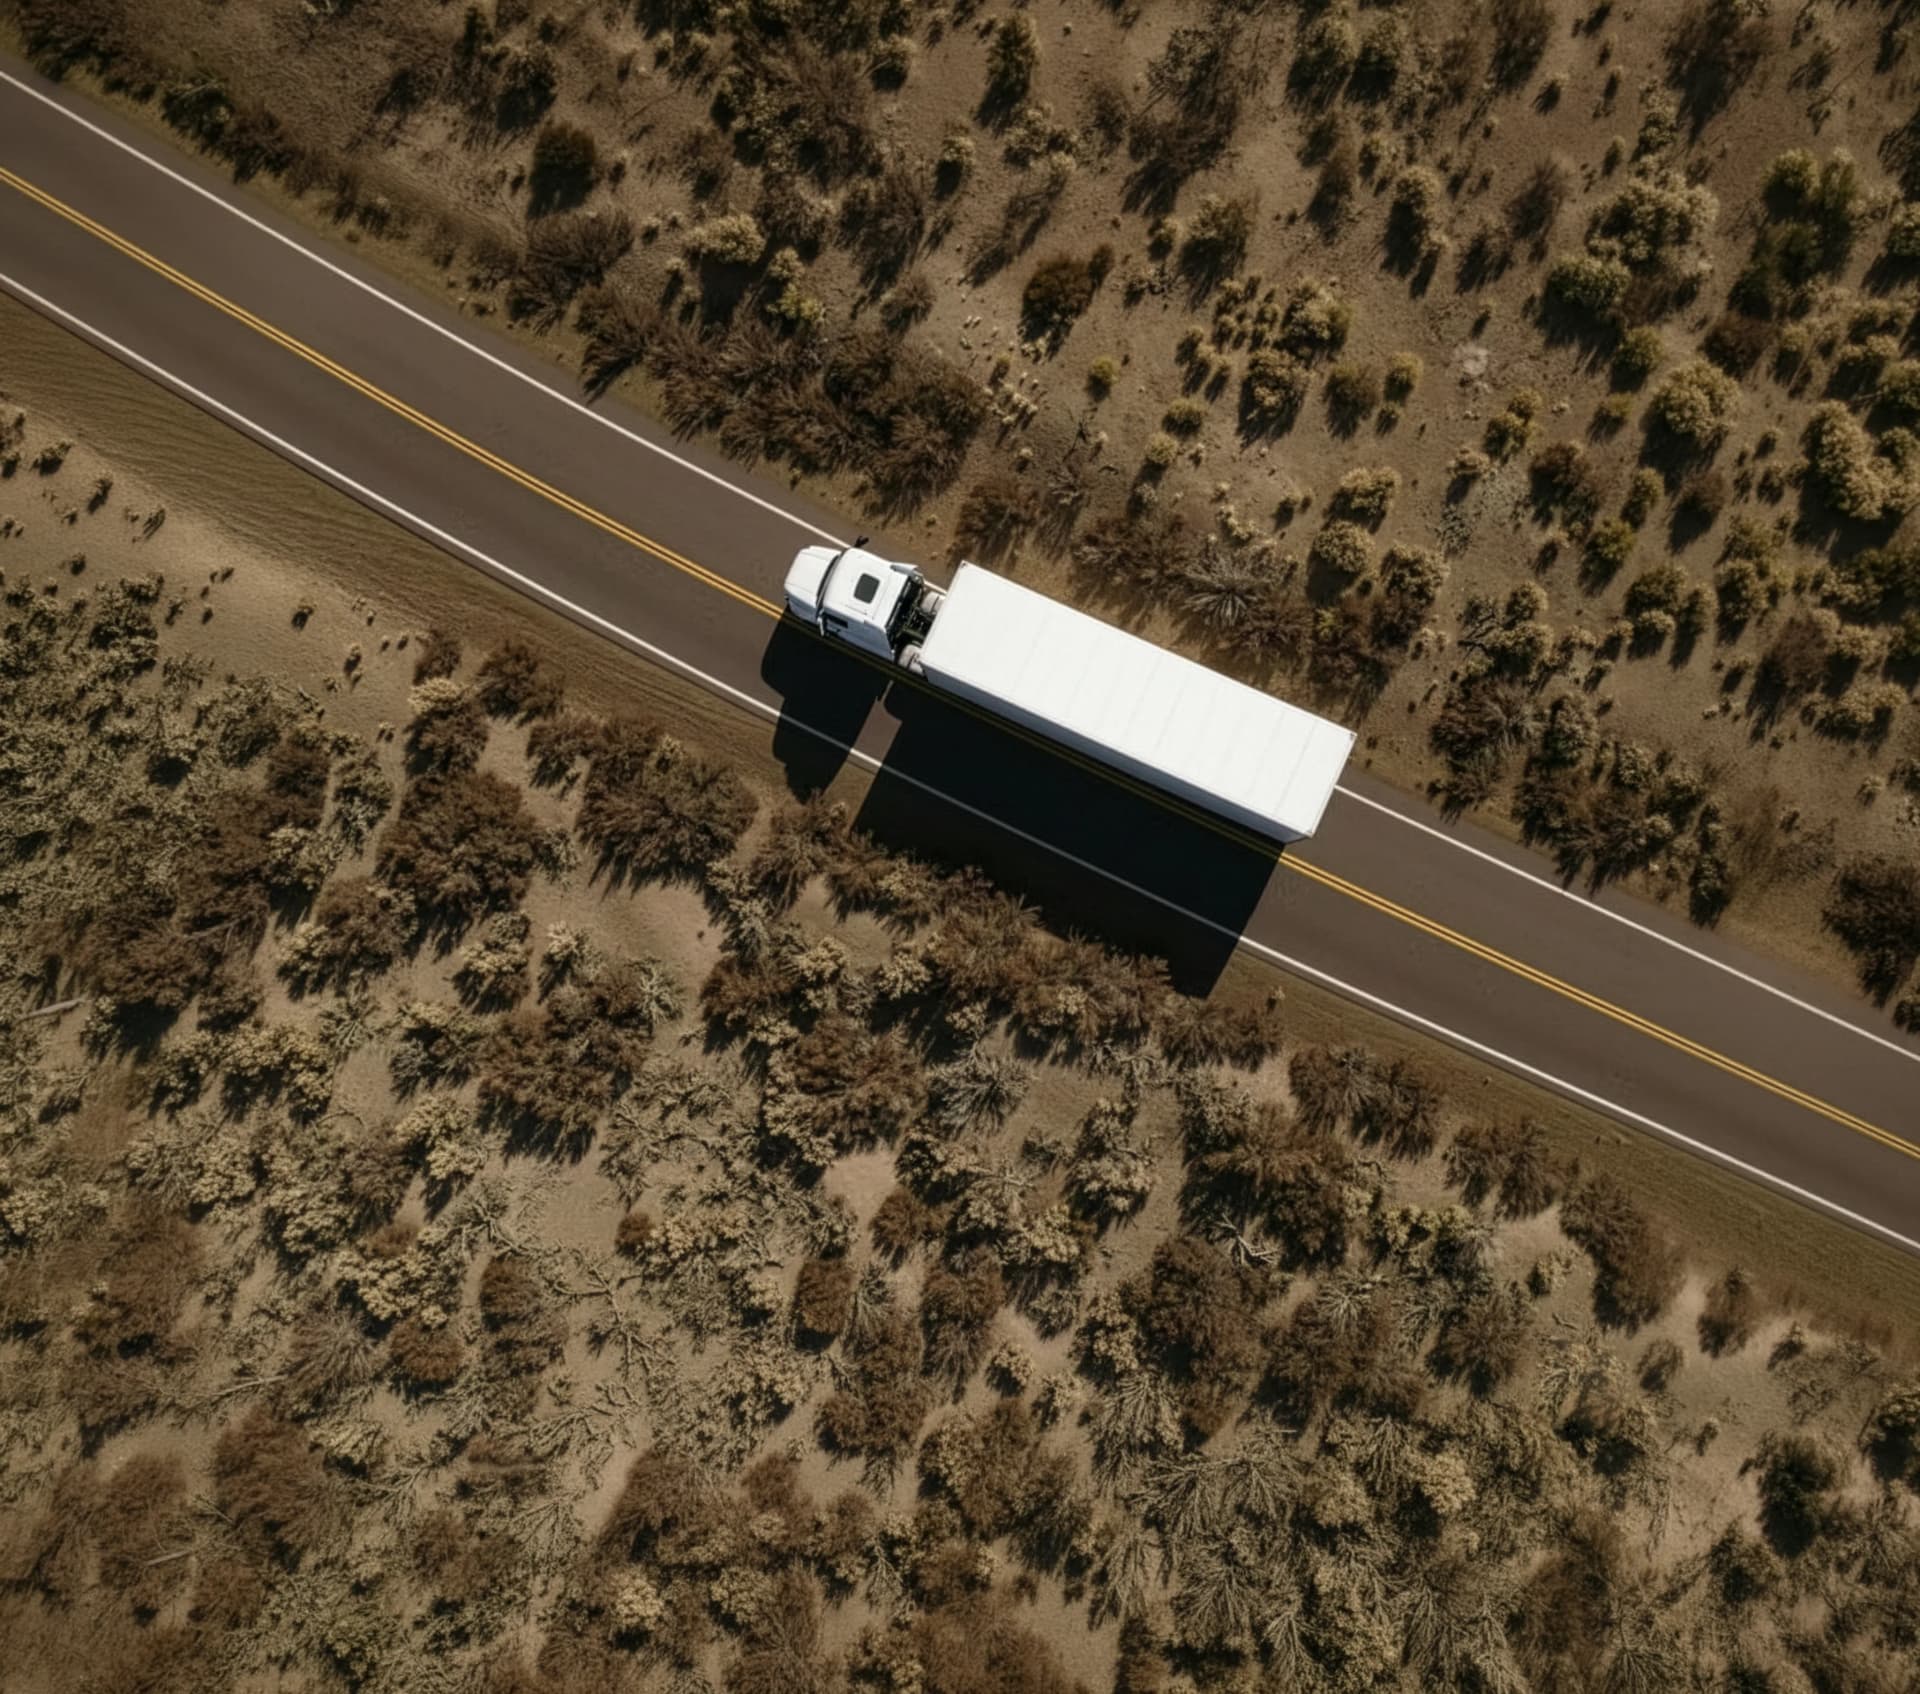
Comparing optimal and actual routes with AI to identify recurring detour patterns and improve average driving distance.

Analyzing temperature data with AI to diagnose the root causes of standard deviations, managing quality compliance through cooling and equipment improvements.
Analyzing GPS-based vehicle operation data with AI to diagnose abnormal stoppage patterns and track driver-specific improvement outcomes.
Comparing optimal and actual routes with AI to identify recurring detour patterns and improve average driving distance.
Analyzing temperature data with AI to diagnose the root causes of standard deviations, managing quality compliance through cooling and equipment improvements.
Analyzing GPS-based vehicle operation data with AI to diagnose abnormal stoppage patterns and track driver-specific improvement outcomes.
Comparing optimal and actual routes with AI to identify recurring detour patterns and improve average driving distance.
Analyzing temperature data with AI to diagnose the root causes of standard deviations, managing quality compliance through cooling and equipment improvements.


Willog Intelligence uncovers hidden inefficiencies in your fleet operations and delivers actionable optimization strategies.
Willog Intelligence uncovers hidden inefficiencies in your fleet operations and delivers actionable optimization strategies.